Marital Satisfaction and Counseling Research Findings
Methodology
This report contains the findings from research study conducted by Barna Group on behalf of Marriage Helper.
Fielding date: April 15 to May 10, 2021
Audience: US adults, ages 18 or older
Sample size: n=1,519
Data collection: online via a panel, in a shared survey
Minimal weighting has been used to ensure the sample is representative based on gender, age, region, ethnicity, and education.
Research Definitions
Faith Segments:
- Christians: Self-identified Christians, including Catholics (64% of all US adults).
- Practicing Christians: Adults who identify as Christian, have attended a church service online or in person in the past month and who say their faith is very important in their life today (21% of all US adults).
- Christians, Non-Practicing: Adults who identify as Christian, but do not meet the definition of Practicing Christian (42% of all US adults).
- Non-Christians: Adults who do not identify as Christian (36% of US adults).
- Churched: Adults who have attended a church within the last 6 months
- Unchurched: Adults who have not attended a church within the last 6 months
Generations:
- Millennials: ages 22-36
- Gen X: ages 37-55
- Boomers: ages 56-74

Note: While Gen Z (ages 18-21) and Elders (ages 75+) are included in the sample, the sample size among these segments are too small to analyze individually.
Marital Satisfaction
“Concerning your marriage, overall how frustrated or satisfied are you?”
- Very Frustrated
- Somewhat Frustrated
- Neutral
- Somewhat Satisfied
- Very Satisfied
Results
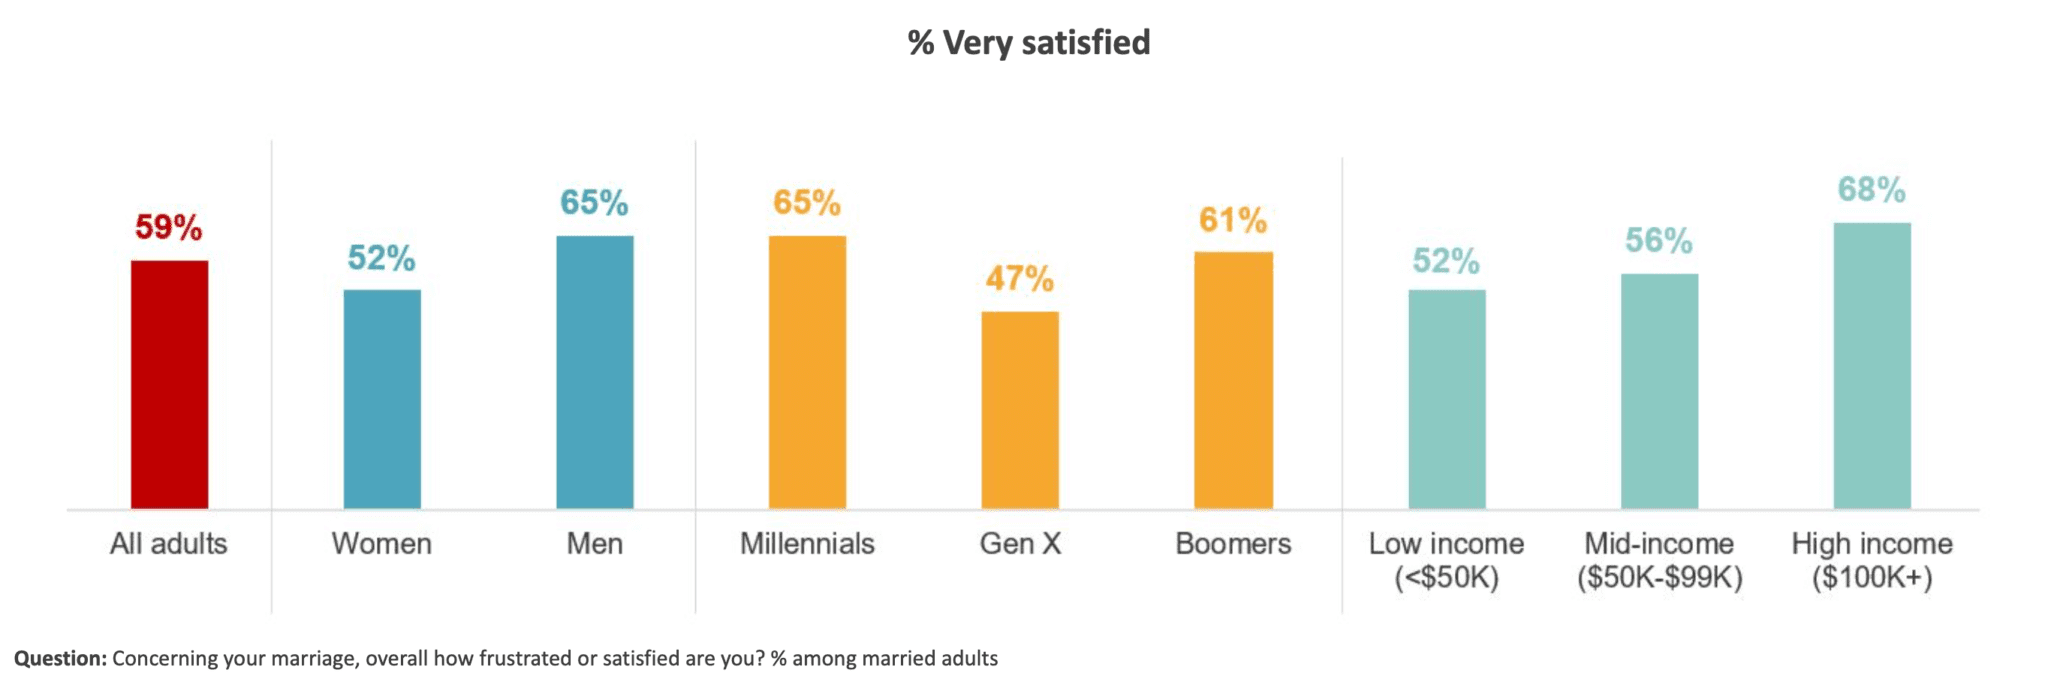
- Three out of five married US adults (59%) say they are very satisfied with their marriage. Fewer than one in ten (9%) say they are very or somewhat frustrated.
- Practicing Christians express significantly more satisfaction than non-practicing Christians or those outside of the Christian faith.

- Men express greater satisfaction in their marriage than do women.
- High income households are more likely than low- and middle-income households to say they are very satisfied.
- Less than half of Gen X is very satisfied, compared to more than three in five Millennials and Boomers.

Marital Counseling
In the past 12 months, have you considered getting help for your marriage?
● Yes
● No
● Not Sure
*Only asked of married adults
Results
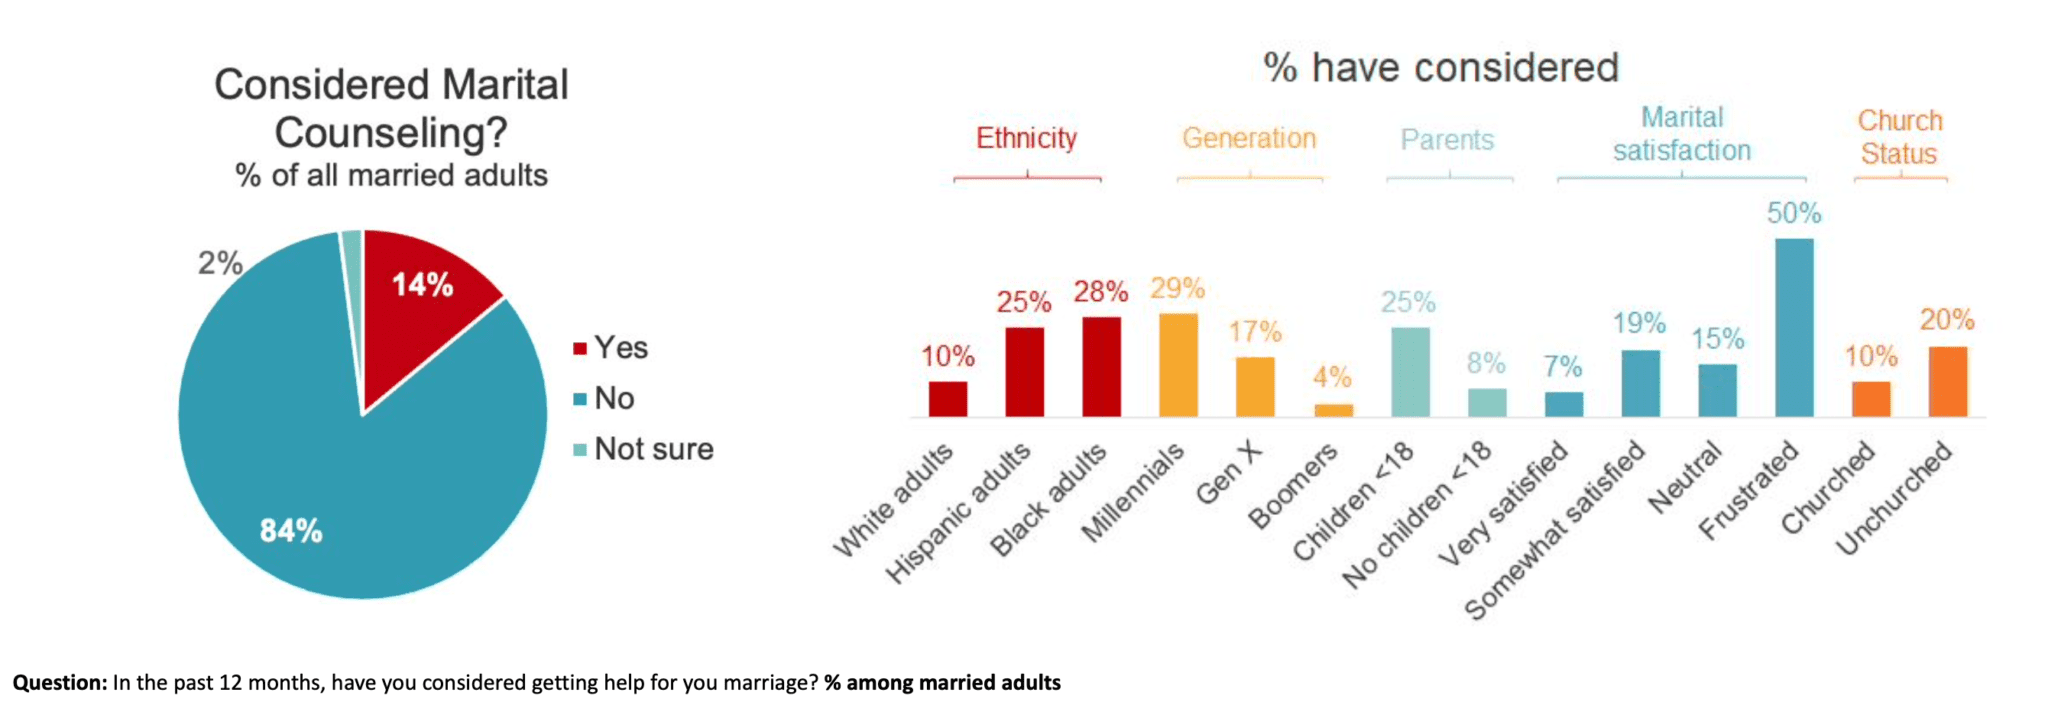
- Overall, one in seven married adults have considered marital counseling. Half of those who are very or somewhat frustrated have considered counseling.
- The younger a person is, the more open they are to seeking marital counseling. Parents of children under 18 and black and Hispanic adults are more likely to consider help.

Final Considerations
- Those most open to marital counseling include ethnic minorities and younger generations. Openness to consider counseling may be less tied to marital satisfaction with these groups.
- Men state an overall slightly higher satisfaction with their marriage.
- Those not self-described as connected to Christianity are more likely to reside in the “middle” when it comes to marital satisfaction. 1 out 6 people who are non-Christian have a neutral perspective on their marriage.
- Consider the impact of raising children. Those in the Gen X age cohort and parents raising children under the age of 18 are more likely to be less satisfied with their marriage and more likely to have considered counseling in the last 12 months.
- People more engaged with their faith are more likely to say they are happy with their marriage.
